Have you ever wondered how top companies and businesses stay ahead of their competitors and always make a strategic move? How do they make it possible?
The answer lies in the implementation of tactics that help to foresee the trends in advance. Implementing business analytics helps to foster business growth by identifying what works and what does not work for your business through its autogenerated reports and compiled dashboards. What if we can speed up the process with clearer visuals? Want to know the secret sauce in further accelerating analytics?
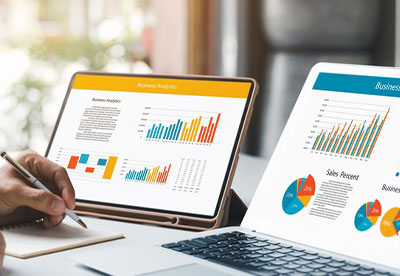
Data Visualization solutions act as a secret ingredient that helps turn raw data into actionable insights and is a secret ingredient in business analytics. As per Statista, global data visualization market revenue in 2017 was 4.51 billion US dollars and in 2023, the market is expected to increase to 7.76 billion US dollars with a CAGR of 9.47 percent. The data speaks for itself, that data visualization solutions are game changers.
To make data look appealing and understandable to the audience, it’s not a choice but a necessity to use data visualization tools. It facilitates analytics to help you visualize data better. Let’s check what benefits real-time data visualization can derive for business analytics
Easily Display Complex Data
Assume data visualization as a storyteller, as it delivers a strong message. With the help of charts, graphs, and bars, it allows decision-makers and users to understand data easily. Additionally, sometimes standard visuals like charts can’t depict complex data having enormous data sets, in such cases visuals have the option to show interactive hierarchies much better.
Application of Dashboards
Accessing all the data at a centralized place helps to have a better understanding of data, businesses can view key performance indicators and get information such as budgets, revenue, costs, sales, and milestones. This helps decision-makers to make necessary adjustments to their operations to achieve desired results.
Accelerates Customer Engagement
Every business not only wants to attract new customers but also to retain the existing ones. Imagine, being able to convey complex findings to your customers that are not only informative but also help in captivating and creating everlasting impact. As the visuals grab quick attention as compared to the text, data visualization techniques prove to be extremely powerful in remembering the findings. It leads to making timely and informed decisions based on findings.
Identify trends and patterns
Data Visualization can unsee the patterns and trends in data that can’t be discovered without its use. These patterns formulate new valuable insights and exploring these trends allows decision-makers to apply or change the existing strategies accordingly. Visualizations by comparing the data help in finding patterns among various elements and help to identify anomalies. These anomalies can highlight trends, exceptions, or issues that may require further attention.
Cost-effective way
Data visualization tools are user-friendly and can be accessed without any extensive training or any specific skill set. This freedom of data analysis saves costs associated with hiring specialized experts. Moreover, it also allows businesses to look after the issues before they multiply, this alert helps in prevent potential costs.
Final words
Data Visualization is a powerful tool that enhances analytics-based decisions, offers great business insights, and valuable statistics, and makes information more engaging. Decision-makers can identify opportunities and threats in advance and stay ahead through data visualization thus driving growth and profitability.
At Canopus Infosystems, with our expertise, we will not only offer data visualization solutions but will be there in your whole data journey from data cleansing, and data management to dashboard and analytics solutions, and help you analyze your big data better.
2 mins read