For financial institutions assessing the risk of the individual while lending money is of due importance to determine whether to extend credit or not. Inaccurate assessment can cost sizable amounts for banks. Analyzing credit risk facilitates identifying, assessing, and mitigating the anticipated risk associated with lending money and all this is done by analyzing the portfolio of individuals and their creditworthiness.
To avoid lending high-risk loans and analyze creditworthy borrowers, banks need a smart model to allocate capital more effectively and at the same time gain a competitive advantage.
This brings us to the question of what strategies can be employed to improve credit risk assessment processes and avoid costly mistakes.
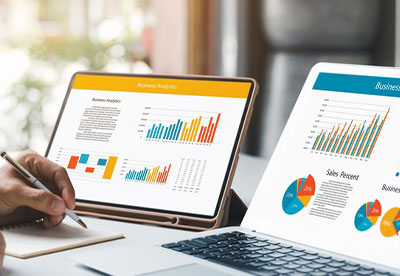
Data visualization is an emerging trend and proves to be a valuable tool to analyze vast amounts of data in a fraction of time. While evaluating a person’s credit risk score, several factors come into play, including debt, payment history, employment status, and others. Data visualization tools can assist banks in improving their visualization of this data by providing a unified view of all the information.
Let’s check what challenges data visualization can tackle and help banks in better analyzing the credit risks-
Data Complexity
Many industries, including banks, deal with mountains of data, and data across the financial industry is highly siloed. In such a scenario, assessing the credit risk of individuals is a daunting task. Earlier banks used to rely on third-party consultants to support their decision-making, but with the advancement of technology, banks are adopting data visualization to simplify the whole process of assessment. Data visualization tools can analyze financial statements, credit scores, and other economic indicators of the customer and can simplify the data by identifying trends and patterns.
Dangers of Limited Real-time Data Visibility
The traditional method of credit risk assessment does not offer real-time visibility into the data and generally is a time-consuming process. Today, portfolio and risk managers can use data visualization to support decision-making by uncovering risk concentrations. Through dashboard analysis, authorities can get a comprehended view of all the significant metrics of customers in a single unified place and can boost data visibility. Real-time data allows lenders to quickly identify and respond to changes in borrower’s credit risk profiles. Without such analysis, lenders may not respond promptly to emerging risks.
Predicting Potential Defaulters
Predicting who will default on returning loans is a major concern and one of the important determinants in extending loans by banks. With the growing complexities of financial transactions, making decisions backed up with robust solutions is crucial for effective risk management. By analyzing historical data and finding trends and patterns, data visualization can predict potential defaulters. Past analysis of data can lead to identifying high-risk and low-risk customers, aiding in sorting the lending decisions for future clients and the existing associated ones.
Profile Segmentation
Customer profile segmentation is crucial for categorizing borrowers into diverse groups based on their credit scores. To tailor their lending strategies, banks usually segment their customers. With data visualization, banks can visualize key risk factors that contribute to borrower’s credit risk profile. With the use of scatter plots or different charts and graphs, it becomes convenient for lenders to identify correlations that can help better understand the risk factors of different borrower segments.
Data Integration
Banks usually get data from multiple sources such as financial statements, financial transactions, and loan applications and they need to integrate all the data to access the credit risk effectively. Additionally, data generated from different sources is of improper format, all this data needs to be converted into a common format that can be easily analyzed. Data visualization tools make this data more suitable to analyze and visualize in a unified manner, offering a complete view of credit risk associated with borrowers.
Final Words
Data Visualization is the need of an hour, irrespective of any industry. When it comes to the financial sector, credit risk assessment is one of the important parameters to gauge the customer risk profile. With the evolution of technology, data visualization tools have outperformed in identifying trends and patterns to identify correlations between different customer segments to better analyze their risk factor.
At Canopus Infosystems, we understand the need of financial institutions in credit risk assessment, and our expertise in developing advanced data visualization solutions can help financial institutions enhance their risk assessment processes and make better-informed lending decisions.
3 mins read


